Matlab Notes-Discrete-time Signals and Systems

Matlab Notes-Discrete-time Signals and Systems
Discrete-time Signals
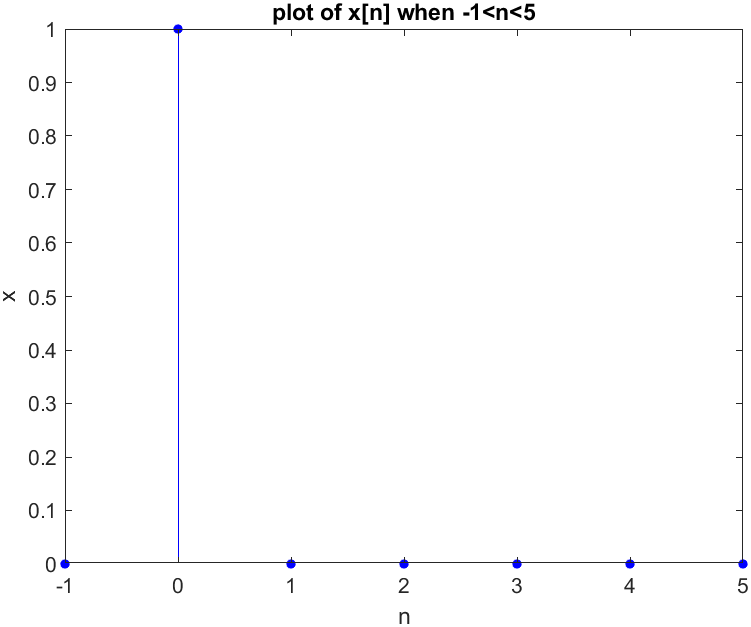
Unit Impluse Signal

Function-impseq.m
1
2
3
4
5
6
% The sequence will range at n1 to n2
% When n=n0 => x=1
function [x, n]=impseq(n0,n1,n2)
n=n1:n2;
x=((n-n0)==0); %if n-n0==0 then x=1 else x=0
endTest Code-test.m
1
2
3
4
[x, n]=impseq(0, -1, 5);
x_plot=stem(n, x, 'b', 'filled');
set(x_plot, 'markersize', 4);
xlabel("n"); ylabel("x"); title('plot of x[n] when -1<n<5');Result

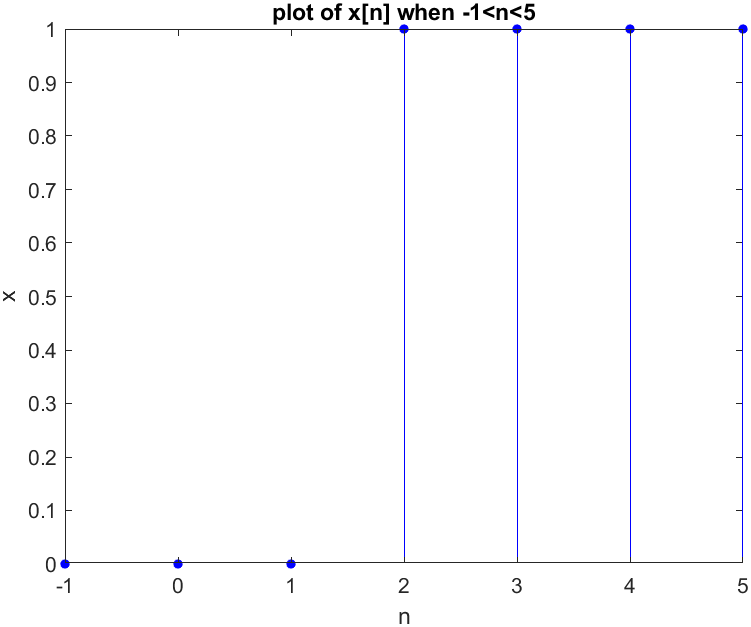
Unit Setp Sequence
Function-uniseq.m
1
2
3
4
5
6
% The sequence will range at n1 to n2
% When n>=n0 => x=1
function [x, n] = uniseq(n0, n1, n2)
n=n1:n2;
x=(n-n0>=0); % If n-n0>=0 => x=1, else => x=0
endTest Code-test.m
1
2
3
4
[x, n] = uniseq(2, -1, 5);
x_plot = stem(n, x, 'b', 'filled');
set(x_plot, 'markersize', 4);
xlabel("n"); ylabel("x"); title('plot of x[n] when -1<n<5');Result

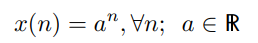
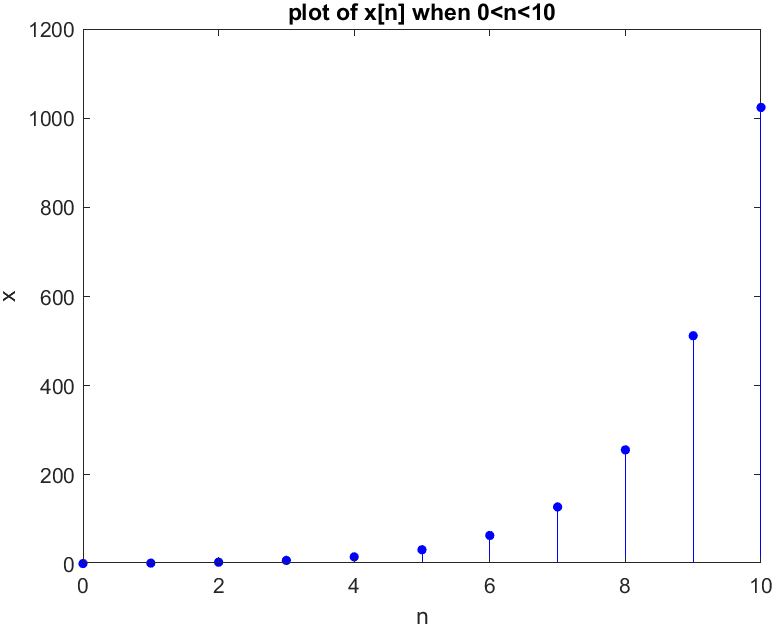
Real-valued Exponential Sequence
Test Code-test.m
1
2
3
4
5n=0:10;
x=2.^(n); % To create a sequence '.' is needed
x_plot=stem(n, x, 'filled', 'b');
set(x_plot, 'markersize', 4); %chagne the size of the circle
xlabel("n"); ylabel("x"); title('plot of x[n] when 0<n<10');Result
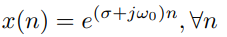
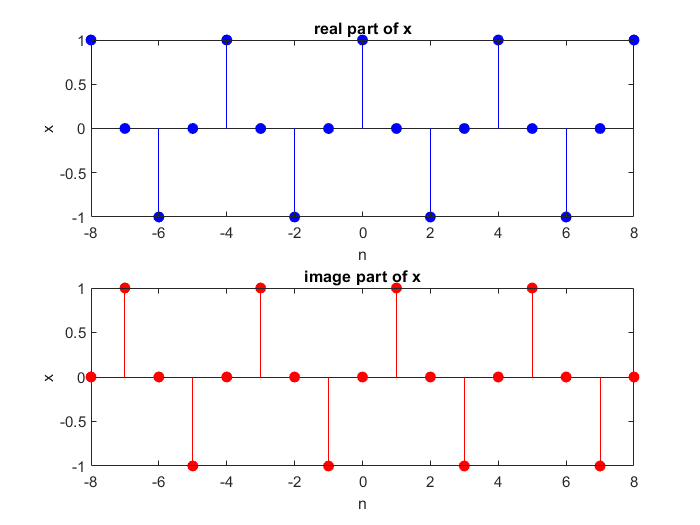
Complex-valued Exponential Sequence
- Where σ produces an attenuation (if <0) or amplification (if
>0) and
is the frequency in radians.
- Where σ produces an attenuation (if <0) or amplification (if
>0) and
Test Code-test.m
1
2
3
4
5
6
7
8
9
10
11
12n=-8:8;
w=0.5*pi;
x=exp(j*w*n);
subplot(2, 1, 1);
x_plot=stem(n, real(x), 'filled', 'b');
title("real part of x");
xlabel("n"); ylabel("x");
subplot(2, 1, 2);
y_plot=stem(n, imag(x), 'filled', 'r');
title("image part of x");
xlabel("n"); ylabel("x");Result
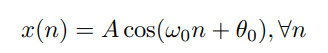
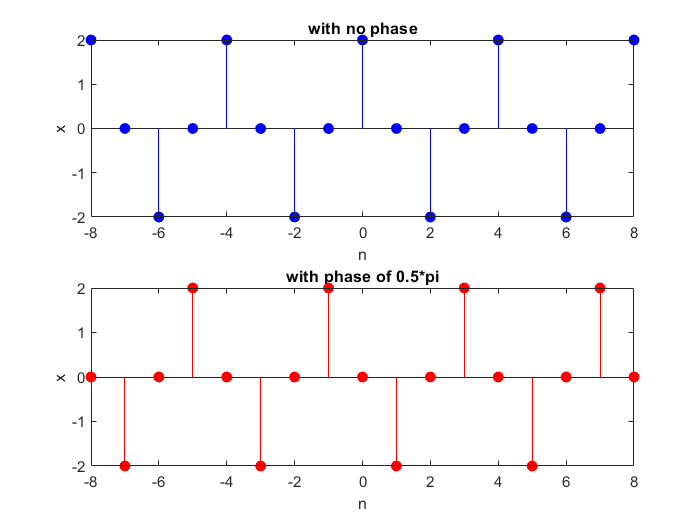
Sinusodial Sequence
- Where A is an amplitude,
is the frequency in radians and is the phase in radians .
- Where A is an amplitude,
Test Code-test.m
1
2
3
4
5
6
7
8
9
10
11
12
13
14
15n=-8:8;
w=0.5*pi;
p1=0*pi;
p2=0.5*pi;
A=2;
x=A*cos(w*n+p1);
y=A*cos(w*n+p2);
subplot(2, 1, 1);
x_plot=stem(n, x, "filled", 'b');
title("with no phase");
xlabel("n"); ylabel("x");
subplot(2, 1, 2);
y_plot=stem(n, y, "filled", 'r');
title("with phase of 0.5*pi");
xlabel("n"); ylabel("x");Result
Random Sequence
The randn(1,N) generates a length N Gaussian random sequence with mean 0 and variance 1.
Test Code-test.m
1
2
3
4
5
x=rand(1,10);
n=1:10;
x_plot=stem(n, x, "filled", 'b');
xlabel("n"); ylabel("random x");
title("random sequence");Result

- Title: Matlab Notes-Discrete-time Signals and Systems
- Author: Shih Jiun Lin
- Created at : 2024-03-05 23:00:47
- Updated at : 2024-03-05 00:16:37
- Link: https://shih-jiun-lin.github.io/2024/03/05/Matlab Notes-Discrete-time Signals and Systems/
- License: This work is licensed under CC BY-NC-SA 4.0.